The Women in Digital Index is a data-driven snapshot of how women progress from STEM learning to ICT leadership across the EU and selected benchmark countries.
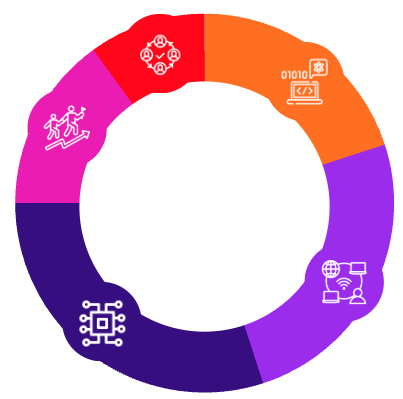
It follows a pipeline approach, tracking women from STEM education to leadership, recognising that barriers exist at every stage.
We have identified the four key phases of the pipeline journey and the key stages along the way with a measure of the time to impact of any intervention to investment. These are:
STEM
Ensuring the equal interest, participation and performance of girls in STEM subjects at primary and secondary education; Stages: Primary School, Secondary School; Time to impact: Long-term
ICT
Participation of women in higher education and training in ICT subjects and related fields; Stages: Undergraduate, Masters, Traineeships, Apprenticeships; Time to impact: Medium-term
DIGITAL
Transition of women from ICT related qualifications to technical roles and remaining in such roles as they progress through their early and middle stages of career. Stages: PhD, Entry-level positions, Mid-level, Time to impact: Short-term
LEADERSHIP
Achieving visible leadership within organisations as directors of units and managing director roles. Stages: Director; Time to impact: Medium-term
The figure below shows the Leaky pipeline of Women in Digital.
Structure & weights
For each stage, there is an established underlying weight that will contribute to the general index, as described below
20%
STEM
25%
ICT
35%
DIGITAL
10%
Leadership
10%
Enabling environment
The Index blends data with expert insight to spotlight gaps, drop-off & the policies that work
To contextualise EU progress, the Index includes the United States, United Kingdom, India and Brazil. These comparisons highlight global best practices and persistent barriers.
Explore the WiD Index to understand where women thrive in digital careers, identify gaps & discover actionable insights to drive change